Krisi Quick Intro Notebook
Welcome to Krisi! This notebook helps you get onboard with the core functionality of Krisi.
By the end you will be able to: * evaluate your Time-Series predictions, * save the results and * generate a report. * comparing multiple scorecards.
Evaluating the results of a single ScoreCard
First, let's import the needed libraries:
Generate normally distributed synthetic data for demonstration purposes
Use the score helper function to evaluate your results
score simply wraps ScoreCard initalization and ScoreCard.evaluate() .
The ScoreCard object is the main engine of krisi. It stores the targets and predictions, the metrics that we have specified (default metrics and custom metrics) and useful optional metadata, such as model_name, dataset_description, etc.
Once we have the ScoreCard evaluated, we can generate various reports with it.
| Model_20230505-1556230b8c065c | |
|---|---|
| Mean Absolute Error | 0.110889 |
| Mean Absolute Percentage Error | 7.385812 |
| Symmetric Mean Absolute Percentage Error | 0.711206 |
| Mean Squared Error | 0.019479 |
| Root Mean Squared Error | 0.139567 |
| R-squared | -0.948928 |
| Mean of the Residuals | 0.002519 |
| Standard Deviation of the Residuals | 0.139614 |
''' Printing a more detailed result by passing in `extended` (this is the default) '''
scorecard.print('extended')
┏━━━━━━━ Result of Model_20230505-1556230b8c065c on Dataset_20230505-155623dd06a4a6 tested on outofsample ━━━━━━━━┓ ┃ ┃ ┃ Targets and Predictions Analysis ┃ ┃ ╭────────────────────┬──────────────────────────────────────────────────────────┬──────────────┬──────────────╮ ┃ ┃ │ Series Type │ Histogram │ Types │ Indicies │ ┃ ┃ ├────────────────────┼──────────────────────────────────────────────────────────┼──────────────┼──────────────┤ ┃ ┃ │ Targets │ ┌──────────────────────────────────────────────────┐ │ NaNs: 0 │ Start: 0 │ ┃ ┃ │ │ 76.0┤ ███ │ │ dtype: │ End: 999 │ ┃ ┃ │ │ 63.3┤ ███████████ │ │ float64 │ │ ┃ ┃ │ │ 50.7┤ ████████████████ │ │ │ │ ┃ ┃ │ │ 38.0┤ ████████████████████ │ │ │ │ ┃ ┃ │ │ 25.3┤ ██████████████████████ │ │ │ │ ┃ ┃ │ │ 12.7┤ ███████████████████████████████ │ │ │ │ ┃ ┃ │ │ 0.0┤█ ██ ██████████████████████████████████████████ ██│ │ │ │ ┃ ┃ │ │ └┬───────────┬────────────┬───────────┬───────────┬┘ │ │ │ ┃ ┃ │ │ -0.35 -0.17 0.01 0.19 0.37 │ │ │ ┃ ┃ ├────────────────────┼──────────────────────────────────────────────────────────┼──────────────┼──────────────┤ ┃ ┃ │ Predictions │ ┌──────────────────────────────────────────────────┐ │ NaNs: 0 │ Start: 0 │ ┃ ┃ │ │ 85.0┤ ██ │ │ dtype: │ End: 999 │ ┃ ┃ │ │ 70.8┤ █████ ████ │ │ float64 │ │ ┃ ┃ │ │ 56.7┤ ██████████ │ │ │ │ ┃ ┃ │ │ 42.5┤ ███████████████ ███ │ │ │ │ ┃ ┃ │ │ 28.3┤ █████████████████████ │ │ │ │ ┃ ┃ │ │ 14.2┤ ██████████████████████████████ │ │ │ │ ┃ ┃ │ │ 0.0┤█ ███████████████████████████████████████████│ │ │ │ ┃ ┃ │ │ └┬───────────┬────────────┬───────────┬───────────┬┘ │ │ │ ┃ ┃ │ │ -0.43 -0.25 -0.07 0.11 0.29 │ │ │ ┃ ┃ ╰────────────────────┴──────────────────────────────────────────────────────────┴──────────────┴──────────────╯ ┃ ┃ Residual Diagnostics ┃ ┃ ╭─────────────────────────┬──────────────────────────────────────────────────────────┬────────────────────────╮ ┃ ┃ │ Metric Name │ Result │ Parameters │ ┃ ┃ ├─────────────────────────┼──────────────────────────────────────────────────────────┼────────────────────────┤ ┃ ┃ │ Residuals (residuals) │ 0 -0.039898 │ {} │ ┃ ┃ │ │ 1 -0.115117 │ │ ┃ ┃ │ │ 2 -0.030332 │ │ ┃ ┃ │ │ 3 -0.047416 │ │ ┃ ┃ │ │ 4 0.008044 │ │ ┃ ┃ │ │ ... │ │ ┃ ┃ │ │ 995 -0.016276 │ │ ┃ ┃ │ │ 996 -0.071913 │ │ ┃ ┃ │ │ 997 0.095479 │ │ ┃ ┃ │ │ 998 -0.161347 │ │ ┃ ┃ │ │ 999 -0.319740 │ │ ┃ ┃ │ │ Length: 1000, dtype: float64 │ │ ┃ ┃ ├─────────────────────────┼──────────────────────────────────────────────────────────┼────────────────────────┤ ┃ ┃ │ Ljung Box Statistics │ lb_stat lb_pvalue │ {} │ ┃ ┃ │ (ljung_box_statistics) │ 1 0.142215 0.706089 │ │ ┃ ┃ │ │ 2 5.292416 0.070920 │ │ ┃ ┃ │ │ 3 8.308879 0.040041 │ │ ┃ ┃ │ │ 4 8.320772 0.080510 │ │ ┃ ┃ │ │ 5 9.975219 0.075940 │ │ ┃ ┃ │ │ 6 10.487945 0.105551 │ │ ┃ ┃ │ │ 7 10.488062 0.162561 │ │ ┃ ┃ │ │ 8 12.309038 0.137939 │ │ ┃ ┃ │ │ 9 12.439323 0.189660 │ │ ┃ ┃ │ │ 10 15.259462 0.122885 │ │ ┃ ┃ ├─────────────────────────┼──────────────────────────────────────────────────────────┼────────────────────────┤ ┃ ┃ │ Mean of the Residuals │ 0.003 │ {} │ ┃ ┃ │ (residuals_mean) │ │ │ ┃ ┃ ├─────────────────────────┼──────────────────────────────────────────────────────────┼────────────────────────┤ ┃ ┃ │ Standard Deviation of │ 0.14 │ {} │ ┃ ┃ │ the Residuals │ │ │ ┃ ┃ │ (residuals_std) │ │ │ ┃ ┃ ╰─────────────────────────┴──────────────────────────────────────────────────────────┴────────────────────────╯ ┃ ┃ Forecast Errors - Regression ┃ ┃ ╭─────────────────────────┬──────────────────────────────────────────────────────────┬────────────────────────╮ ┃ ┃ │ Mean Absolute Error │ 0.111 │ {} │ ┃ ┃ │ (mae) │ │ │ ┃ ┃ ├─────────────────────────┼──────────────────────────────────────────────────────────┼────────────────────────┤ ┃ ┃ │ Mean Absolute │ 7.386 │ {} │ ┃ ┃ │ Percentage Error (mape) │ │ │ ┃ ┃ ├─────────────────────────┼──────────────────────────────────────────────────────────┼────────────────────────┤ ┃ ┃ │ Symmetric Mean Absolute │ 0.711 │ {} │ ┃ ┃ │ Percentage Error │ │ │ ┃ ┃ │ (smape) │ │ │ ┃ ┃ ├─────────────────────────┼──────────────────────────────────────────────────────────┼────────────────────────┤ ┃ ┃ │ Mean Squared Error │ 0.019 │ {'squared': True} │ ┃ ┃ │ (mse) │ │ │ ┃ ┃ ├─────────────────────────┼──────────────────────────────────────────────────────────┼────────────────────────┤ ┃ ┃ │ Root Mean Squared Error │ 0.14 │ {'squared': False} │ ┃ ┃ │ (rmse) │ │ │ ┃ ┃ ├─────────────────────────┼──────────────────────────────────────────────────────────┼────────────────────────┤ ┃ ┃ │ Root Mean Squared Log │ 'Mean Squared Logarithmic Error cannot be used when │ {'squared': False} │ ┃ ┃ │ Error (rmsle) │ targets contain negative values.' │ │ ┃ ┃ ├─────────────────────────┼──────────────────────────────────────────────────────────┼────────────────────────┤ ┃ ┃ │ R-squared (r_two) │ -0.949 │ {} │ ┃ ┃ ╰─────────────────────────┴──────────────────────────────────────────────────────────┴────────────────────────╯ ┃ ┃ ┃ ┗━━━━━━━━━━━━━━━━━━━━━━━━━━━━━━━━━━━━━━━━━━━━━━━━━━━━━━━━━━━━━━━━━━━━━━━━━━━━━━━━━━━━━━━━━━━━━━━━━━━━━━━━━━━━━━━━━┛
In jupyter notebook you can return the object and get a minimal report and the console representation printed (for exploring while debugging)
| Model_20230505-1556230b8c065c | |
|---|---|
| Mean Absolute Error | 0.110889 |
| Mean Absolute Percentage Error | 7.385812 |
| Symmetric Mean Absolute Percentage Error | 0.711206 |
| Mean Squared Error | 0.019479 |
| Root Mean Squared Error | 0.139567 |
| R-squared | -0.948928 |
| Mean of the Residuals | 0.002519 |
| Standard Deviation of the Residuals | 0.139614 |
<krisi.evaluate.scorecard.ScoreCard object at 0x29c6a4670>
Evaluating on a rolling basis
The most important feature of krisi is that you can evaluate metrics over time.
scorecard_rolling = score(y, predictions, calculation='rolling') # calculation can be 'rolling', 'single' or 'both'
/Users/daniel/mambaforge/envs/krisitest/lib/python3.10/site-packages/sklearn/metrics/_regression.py:918: UndefinedMetricWarning:

R^2 score is not well-defined with less than two samples.
We can then generate an interactive (html dash) and pdf report, but first let's save the scorecard!
Save and load ScoreCards
When saving a scorecard we can decide if we also want to save the console output, by specifying save_modes. Options are:
* SaveModes.minimal (Minimal output as previously in the cell)
* SaveModes.obj (Saves the entire object to a pickle file)
* SaveModes.text (Saves the output of the console into a txt file)
* SaveModes.svg (Creates an svg image of the console output)
* SaveModes.html (Creates an html version of the console output)
Let's just save the scorecard object that we can load in later, by passing in either [SaveMode.obj] or simply ["obj"].
Two things to note:
* The scorecard gets saved by default to output/<project_name>/<scorecards>/<current_time>. However, we only need to worry about the project_name when loading, our helper function scans the directory of the specified project.
* ScoreCard.save() throws back itself, so that you can immediately chain a print()
scorecard.metadata.project_name = "Our example project"
scorecard.save(save_modes=["obj"]).print('minimal')
| Model_20230505-1556230b8c065c | |
|---|---|
| Mean Absolute Error | 0.110889 |
| Mean Absolute Percentage Error | 7.385812 |
| Symmetric Mean Absolute Percentage Error | 0.711206 |
| Mean Squared Error | 0.019479 |
| Root Mean Squared Error | 0.139567 |
| R-squared | -0.948928 |
| Mean of the Residuals | 0.002519 |
| Standard Deviation of the Residuals | 0.139614 |
Once we have saved the object we can load it in. load_scorecards loads in all scorecards from a project
Compare multiple scorecards
from krisi import compare

compare([score(np.random.random(1000), np.random.random(1000)) for _ in range(5)], sort_by='rmse', metric_keys=['mae', 'mse'])
| rmse | mae | mse | |
|---|---|---|---|
| Model_20230505-155623f4dca2dc | 0.141890 | 0.111921 | 0.020133 |
| Model_20230505-155623091dd4f4 | 0.140953 | 0.113679 | 0.019868 |
| Model_20230505-155623d050bca6 | 0.140538 | 0.112274 | 0.019751 |
| Model_20230505-155623b6186a6d | 0.140259 | 0.112374 | 0.019673 |
| Model_20230505-1556234df3034c | 0.138824 | 0.111550 | 0.019272 |
You can also save scorecards and load them in. krisi will save and load from the directory under the same project_name so we should specify the name.
project_name = "Comparing Multiple Scorecards"

for i in range(5):
    score(np.random.random(1000),
          np.random.random(1000),
          project_name=project_name).save()

compare(load_scorecards(project_name), sort_by='rmse', metric_keys=['mae', 'mse'])
| rmse | mae | mse | |
|---|---|---|---|
| Model_20230505-1556239fd52082 | 0.145031 | 0.114443 | 0.021034 |
| Model_20230505-15562381bcb4bc | 0.144074 | 0.113683 | 0.020757 |
| Model_20230505-155623b6723ba4 | 0.142404 | 0.113606 | 0.020279 |
| Model_20230505-155623bcce900c | 0.140336 | 0.112343 | 0.019694 |
| Model_20230505-155623a79f49e0 | 0.140335 | 0.111867 | 0.019694 |
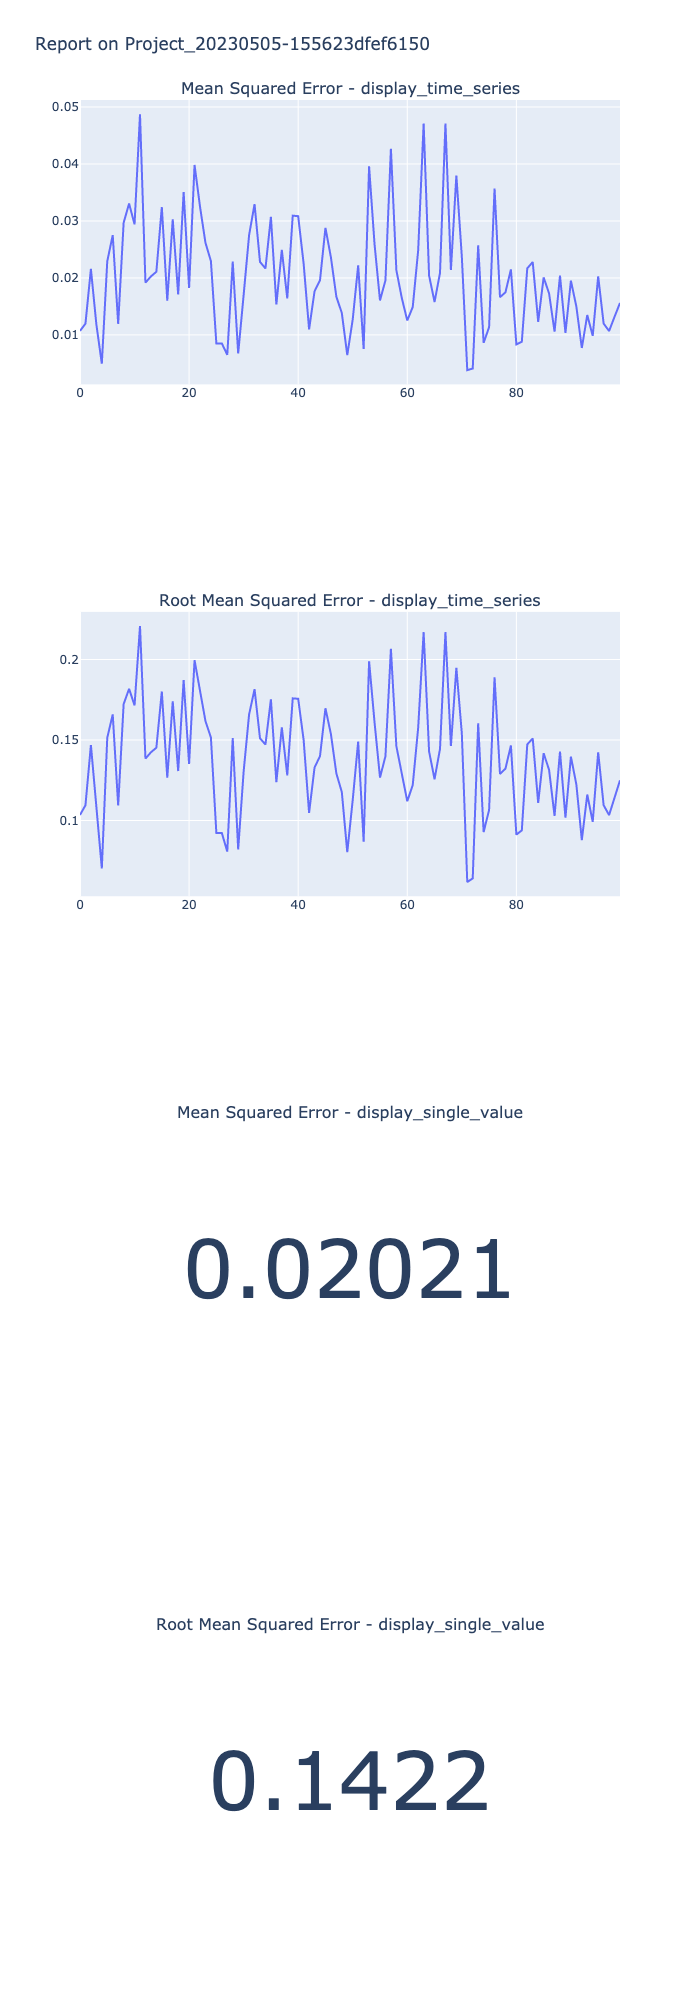
Creating Reports
For reporting you need to install krisi[plotting]: pip install krisi[plotting]
There are five modes for reports:
* DisplayMode.pdf or pdf: Creates a pdf report from the evaluated ScoreCard)
* DisplayMode.interactive or interactive: Creates an interactive web version of the ScoreCard with Dash)
* DisplayMode.direct or direct: Displays the plots individually directly in the notebook or webpage if launch outside of a notebook
* DisplayMode.direct_save or direct_save: Saves the plots individually
* DisplayMode.direct_one_subplot or direct_one_subplot: Same as direct, except all plots are contained in one plot as subplots.
scorecard.generate_report() can receive a list of DisplayModes so you can mix and match the view (eg.: generate a pdf and also launch an interactive exploration)
For saved files look in output/<project_name> for saved plots look in output/<project_name>/diagrams
/Users/daniel/mambaforge/envs/krisitest/lib/python3.10/site-packages/sklearn/metrics/_regression.py:918: UndefinedMetricWarning:

R^2 score is not well-defined with less than two samples.
 # We can slice the scorecard to only include the metrics we want to display
scorecard_rolling[['rmse', 'mse']].generate_report('direct_one_subplot')